QC plots code design
The qc_plots2 module follows an object-oriented approach to the data and plots. Datasets are represented
by qc_plots2.TcconData instances. These instances wrap a netCDF dataset and provide several methods to
access the data - get_data and get_flag0_or_all_data. The former will return a certain category of data
(all, flag = 0, or flag > 0 data currently). Using these intermediate methods allows the instance to impose some
additional constraints on the data returned; for example, reference data is configured to limit what it returns
to the same time period as the main (and context, if available) data. The second method provides the “default”
data, which is flag = 0 data if that instance knows how to find flag = 0 data, otherwise it is all data.
Plots are represented by subclasses of the AbstractPlot class. This abstract
class defines the framework of methods any plot kind must implement. Each plot kind allowed in the configuration
file has a corresponding class in qc_plots2. The figure below shows the inheritance graph
for the various plot classes. When one plot needs only to add or adjust functionality of another, it can inherit
from another concrete plot class. For example, several plot kinds inherit from TimeseriesPlot,
as they are fundamentally time series, but with additional functionality.
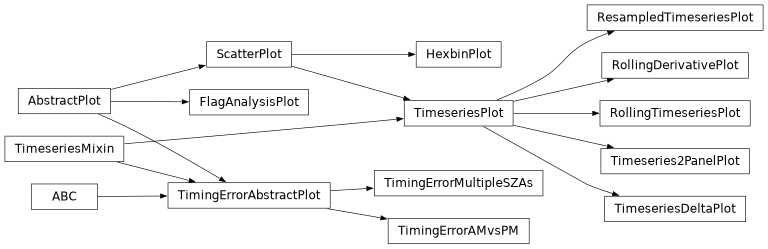
Inheritance diagram for the various plot classes. Note that ABC is the abstract base class,
not actually a plot class.
There is a very close correspondance between the __init__ method of the plot classes and the plot configuration
file. Except for the self, other_plots, default_style, and limits keyword, all the arguments in a
plot class’s __init__ method correspond to valid configuration options in the plot configuration file. Arguments
without a default value are required in the configuration file, others are optional.
Note
The from_config_section() method creates plot class instances from
sections in the configuration file.
Plot instance methods
The idea behind separating each plot type into its own class is that this keeps code for each plot class grouped together, but encourages reuse of code by inheriting from parent classes. In this section, we’ll go over the general structure of a plot class and cover the main methods that you would likely customize one or more of in new plot classes. Below is a figure showing the relationship among these methods.

Call structure for the key methods in a plot class.
In any plot class, the make_plots method is the main entry point. This will be called by the main script with
relevant command line values (like where to save the figure to) as well as a list of all available data, as
TcconData instances. It must ultimately save a figure as an image (usually PNG format)
and return a path to that image.
make_plots usually first calls setup_figure. This method is responsible for creating the figure and axes to
plot into, as well as setting limits, axes labels, tick formatting, etc. It must return the handle to the figure and
axes (or array of axes handles, if >1 axes needed).
_plot handles the actual plotting. It is called with each TcconData instance in turn;
if one or more of those instances should be skipped, make_plots should skip it. (For example, the
FlagAnalysisPlot only plots the main data, so make_plots handles skipping over the
reference and context data, if they are present.)
Within _plot, usually the first step is to call get_plot_args, which returns a list of arguments for separate
plotting calls. Each entry in the list represents a different subset of the data to plot. For example, if plotting
flag = 0 and flag > 0 data separately, then get_plot_args would return a two-element list. Each element of the
list is usually a dictionary, often with keys “data”, “kws”, and “legend_kws”. “data” points to the data that will
be plotted, “kws” would have the style keywords to pass to the plotting function, and “legend_kws” would have keywords
to use when creating the legend.
Note
Often “legend_kws” values are only used from the first element in a list of plot arguments.
get_plot_args relies on three other functions to get the different parts of the arguments. get_plot_data should,
given a TcconData instance and a flag category (e.g. all, flag = 0, or flag > 0 data),
return the subset of data corresponding to the given flag category to use in the plot for that. Any preprocessing of the
data (like calculating rolling medians) usually happens in get_plot_data. Likewise, get_plot_kws returns the style
keywords to use for the given flag category. This is also where fallback styles are usually set; for instance,
ScatterPlot will set the linestyle to “none” and marker to “.” if those weren’t set by
any of the configured styles, since these are needed to make a scatter plot, rather than a line plot. Finally,
get_legend_kws returns style keywords for the legend, merging legend keywords from the style with plot-specific keyword.
Back in _plot, once it has received the list of plotting arguments, it loops through them and plots each subset
of data into the axes provided to it. Once the plotting is complete, make_plots will need to save the plot as a PNG
and return the path to that image.
Getting style keywords
Getting the final set of style keywords for a given plot can be complicated, since it needs to merge default styles for
a given plot type with data type-specific styles. When the plot configuration file is read, default styles are stored in
each concrete plot instance. The plot instances each store styles for all plot kinds, in order to allow for styles to
be cloned from one plot kind to another. Likewise, each TcconData instance stores the
dictionary of plot styles relevant for its data category (main, context, reference).
Recall from the Styles section of the configuration documentation that styles are organized by
data category -> plot kind -> data subset. Generally the algorithm that get_plot_kws follows is:
Get the default styles for the current plot kind from the
AbstractPlotsubclass instance.If the default styles have a style for the current data subset, get that style. If not, but do have a “clone” directive, get the styles for the cloned plot kind and check if those have the right data subset. If not, return an empty dict.
Get the data category-specific styles from the
TcconDatainstance. Follow the same approach as for the default styles to get the subset-specific style.Merge the default and data category-specific options, with the specific options overriding the default options wherever there is a conflict.
Implementations of get_plot_kws usually rely heavily on the helper _get_style method. This method handles getting
the correct style for the data subset, including looking it up from the cloned plot type if needed.
Getting legend keywords
Legend keywords can be specified differently for different instances of the same plot kind. To keep things simple,
legend keywords defined in the style section of the configuration file, rather than the plots section, can only be
defined in the “default” subsection, not any of the data category-specific subsections. When a plot instance is created,
any plot-specific legend keywords are stored on that instance. The get_legend_kws method then only has to retrieve the
default style legend keywords and merge them with the instance-specific keywords. It also relies on the _get_style
method to retrieve the default legend style, in order to allow legend keywords to be cloned just like the plot styles
themselves.
Auxiliary plots
Auxiliary plots are currently implemented as mixin-type classes that inherit from the abstract class
qc_plots.qc_plots2.AuxPlotMixin. For an example, see the qc_plots.qc_plots2.ViolinAuxPlot
class and its usage. Note how it is always the second parent class of classes that inherit from it. These classes
can assume they will have access through self to any methods defined on AbstractPlot.
To enable a main plot + auxiliary plot combination, you will need to implement a class that inherits from both the main plot
class and the auxiliary plot mixin class. The __init__ method of the combined class will need to accept arguments required by
both and distribute them to the parent classes appropriately. For this reason, it is best if the auxiliary plot mixin class
does its initialization in a method other than __init__, so that the combined class can easily call it explicitly.
Note
It will make things much easier on users if you keep the auxiliary input parameter names the same for all combined classes using
a particular auxiliary mixin. For example, all of the classes that inherit from ViolinAuxPlot
use violin_data_file as the parameter to accept the path to the file to plot data from. This way the user can always
use the same line in their config file, and won’t have to change the parameter key across main plot types.
Since the auxiliary plot has the potential to be inherited by many child classes, it will be helpful if you can encapsulate most
of the functionality needed to plot both the main and auxiliary plots on the auxiliary mixin class. In
qc_plots.qc_plots2.ViolinAuxPlot, this is accomplished by having alternatively-named versions of key methods
(such as setup_figure_with_violins in lieu of setup_figure or get_save_name_with_violins in lieu of
get_save_name). These call their normal versions as needed internally. The overall behavior is wrapped up in
make_plot_with_violins, which combines calls to the alternative and regular methods as needed. In most classes that inherit
from qc_plots.qc_plots2.ViolinAuxPlot, all that is needed is to call make_plot_with_violins from inside the
make_plot method, and everything is taken care of with minimal code duplication.
As each main + auxiliary plot combination is its own child of AbstractPlot, each must have
a unique plot_kind attribute. This should have the form of “main_plot+aux_plot”, e.g. “timeseries+violin”. Being consistent
about the auxiliary plot component of the name across all implementations will make it easier for users to remember the correct
name when writing their configuration files.
Note
It is critical that the part before the + matches the main plot’s plot_kind value exactly. Both
_get_style() and Limits rely on this
to fall back on the proper main plot style/limits if needed.
Loading extra data
Each auxiliary mixin must define the method get_extra_data_files_required that returns a sequence of paths to netCDF files
to load. The main function will load each unique file once and store it in a dictionary. The mixin will receive this dictionary
to its make_plot method and will be responsible for pulling out the correct dataset. Since converting the time dimensions
in each of the input files is one of the slower parts of this code, this approach avoids doing that more than necessary.
Pros and cons this auxiliary plot design
In theory, this approach of having combination plot classes that inherit from both the main and auxiliary plot class provides flexibility in implementation. The combination class can override whatever methods from its parents it needs to make that specific combination work.
The main downside is that it still requires quite a bit of manual work to implement each combination class; the custom __init__
method that divides up the various inputs must be created, and at the very least, the make_plot method needs overridden to
correctly make both the main and auxiliary plots. This puts a severe limit on the possibility of combining more than one auxiliary
plot with any given main plot, as a unique class would have to be created for each possible combination.
A cleaner approach would be to compose a master plotting class out of one main and zero or more auxiliary plotting classes. This master class would need to deduce how to set up the figure based on the requirements of all the component plots, then distribute the correct axes and data to each component. If those problems could be solved, this code could be significantly simplified. A related redesign could separate data extraction from plotting, thus each master plot would have components:
a data loader that extracts variables from each of the input datasets
one or more plotters that take the data provided by the loader and its axes and creates the desired plots
Separating the data loader from the plotter should reduce the complexity of the inheritance in this code (ideally to only
a single layer: AbstractDataLoader -> ConcreteDataLoaders, etc.). This would be a prime example of using
composition over inheritance,
but needs a not-insignificant rebuild to implement.